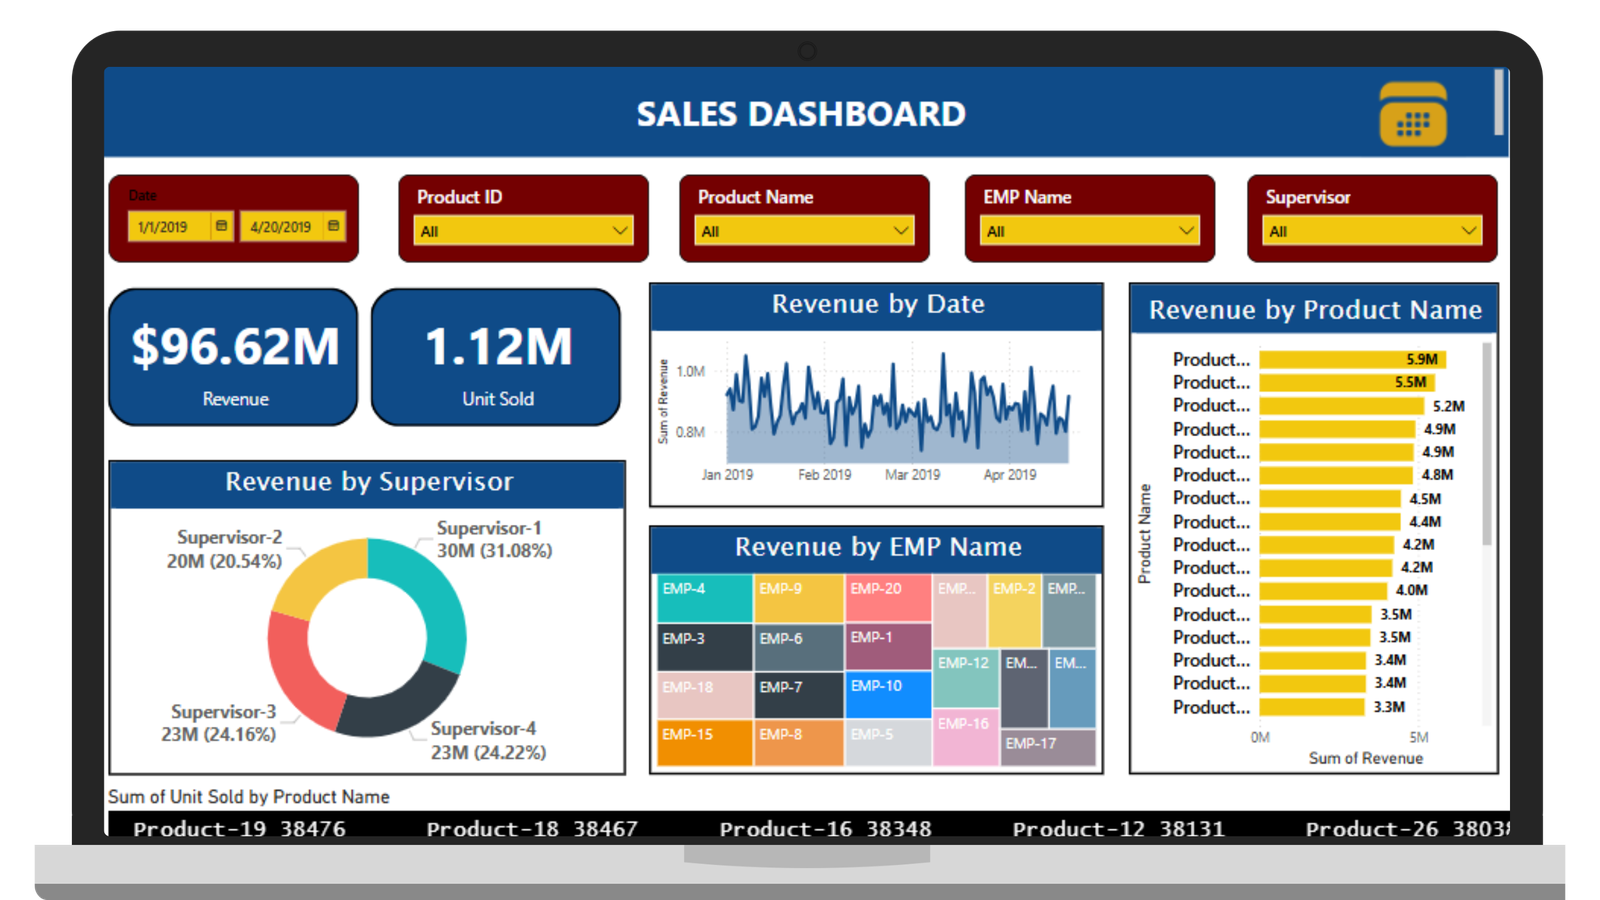
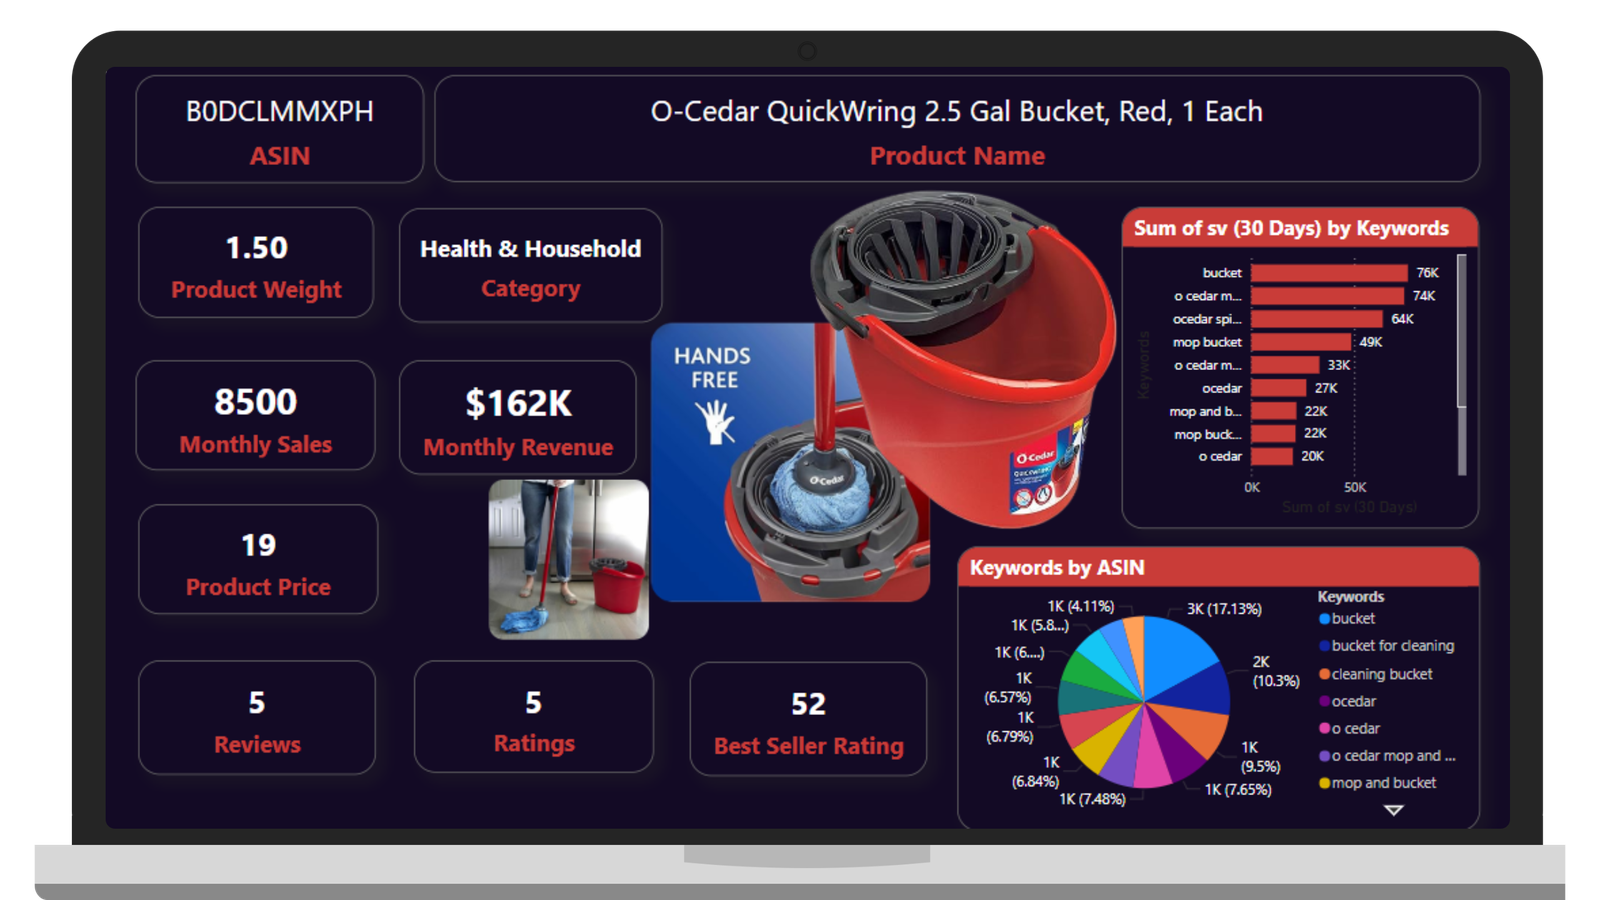
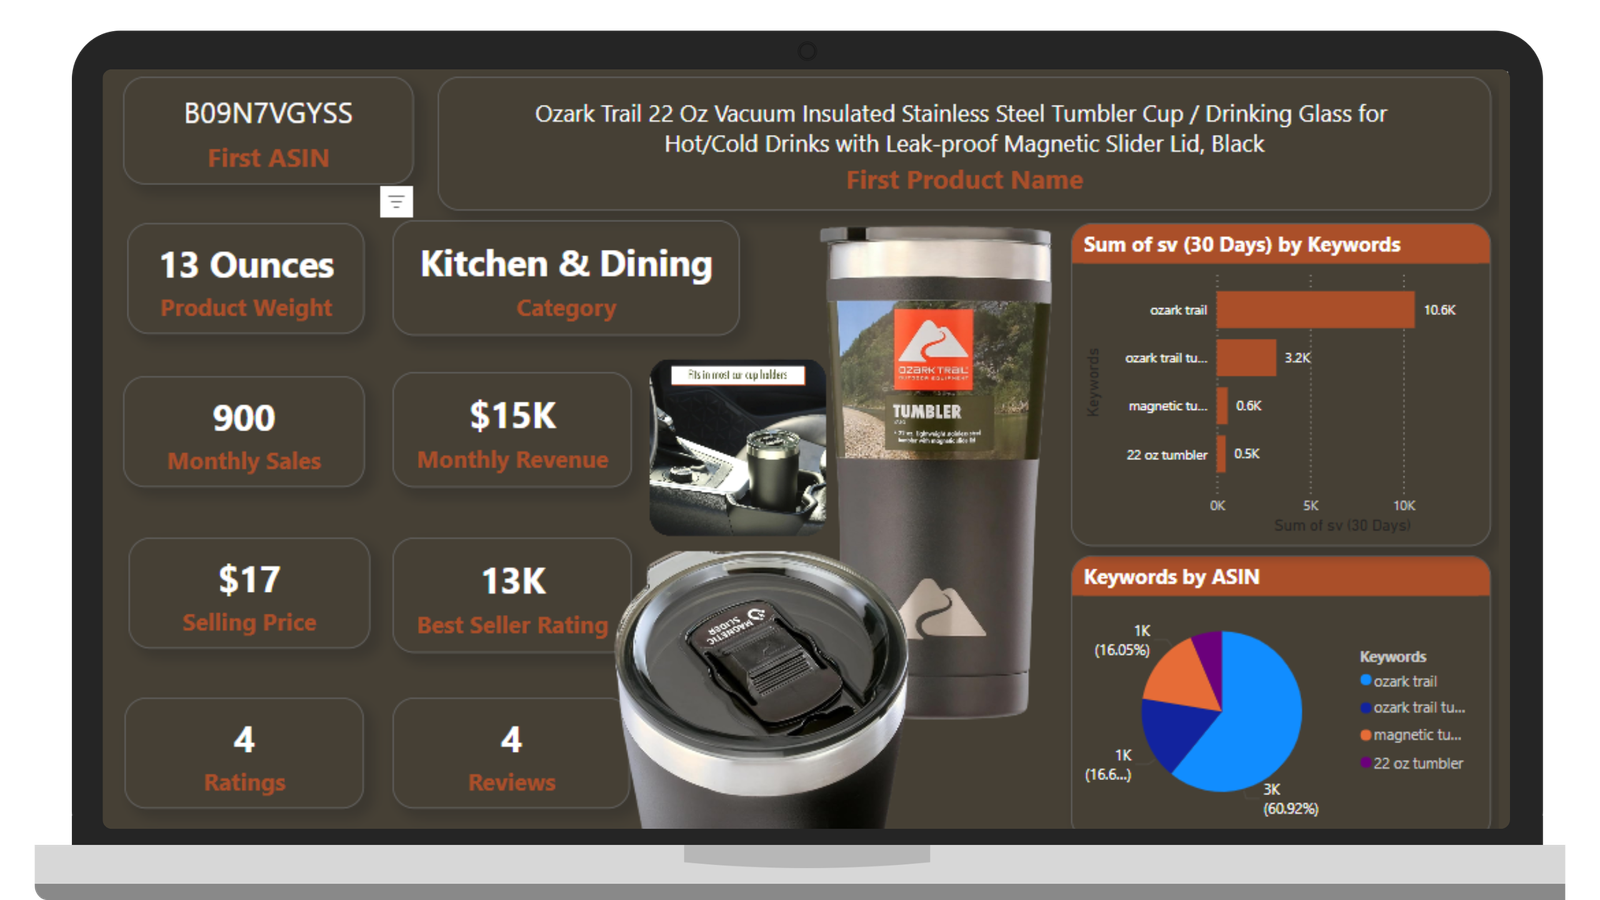
Designed an interactive Superstore Sales Dashboard in Power BI, using dynamic filtering, KPI tracking, and advanced visual analytics to monitor sales performance and category trends. Optimized for fast, data-driven decision-making and actionable business insights.
Interactive and User-Friendly Power BI Dashboard.
Insightful Visuals to Highlight Key Business Metrics.
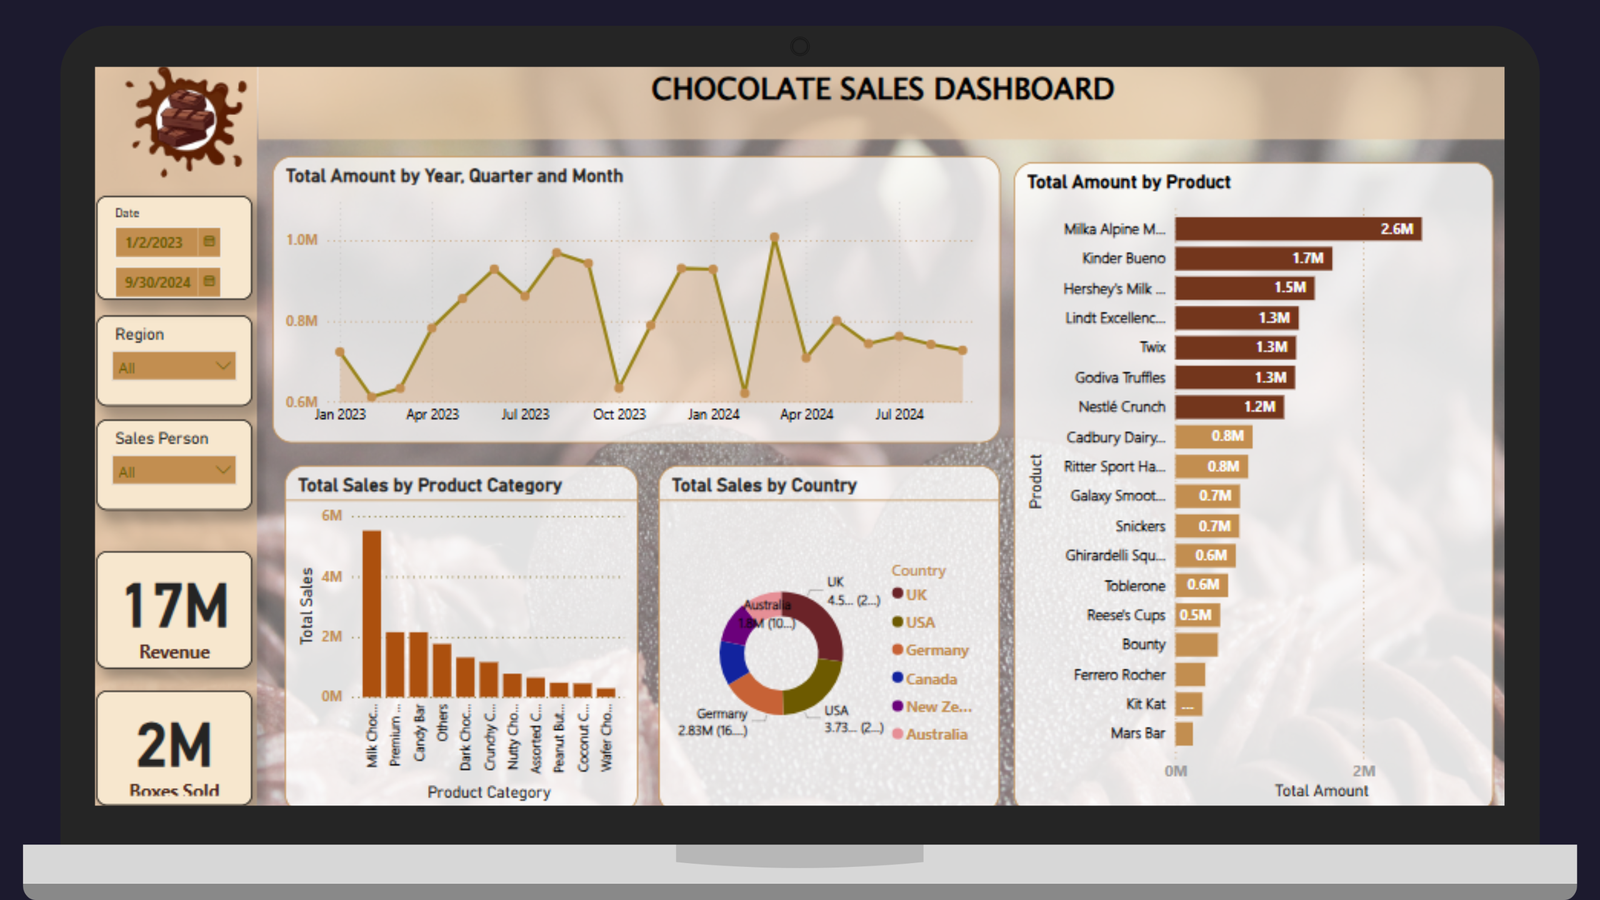
The Chocolate Sales Dashboard in Power BI incorporates dynamic filters and performance metrics across products and regions. It is designed to enhance analytical efficiency and support strategic, data-driven decision-making.
Interactive and User-Friendly Power BI Dashboard.
Insightful Visuals to Highlight Key Business Metrics.
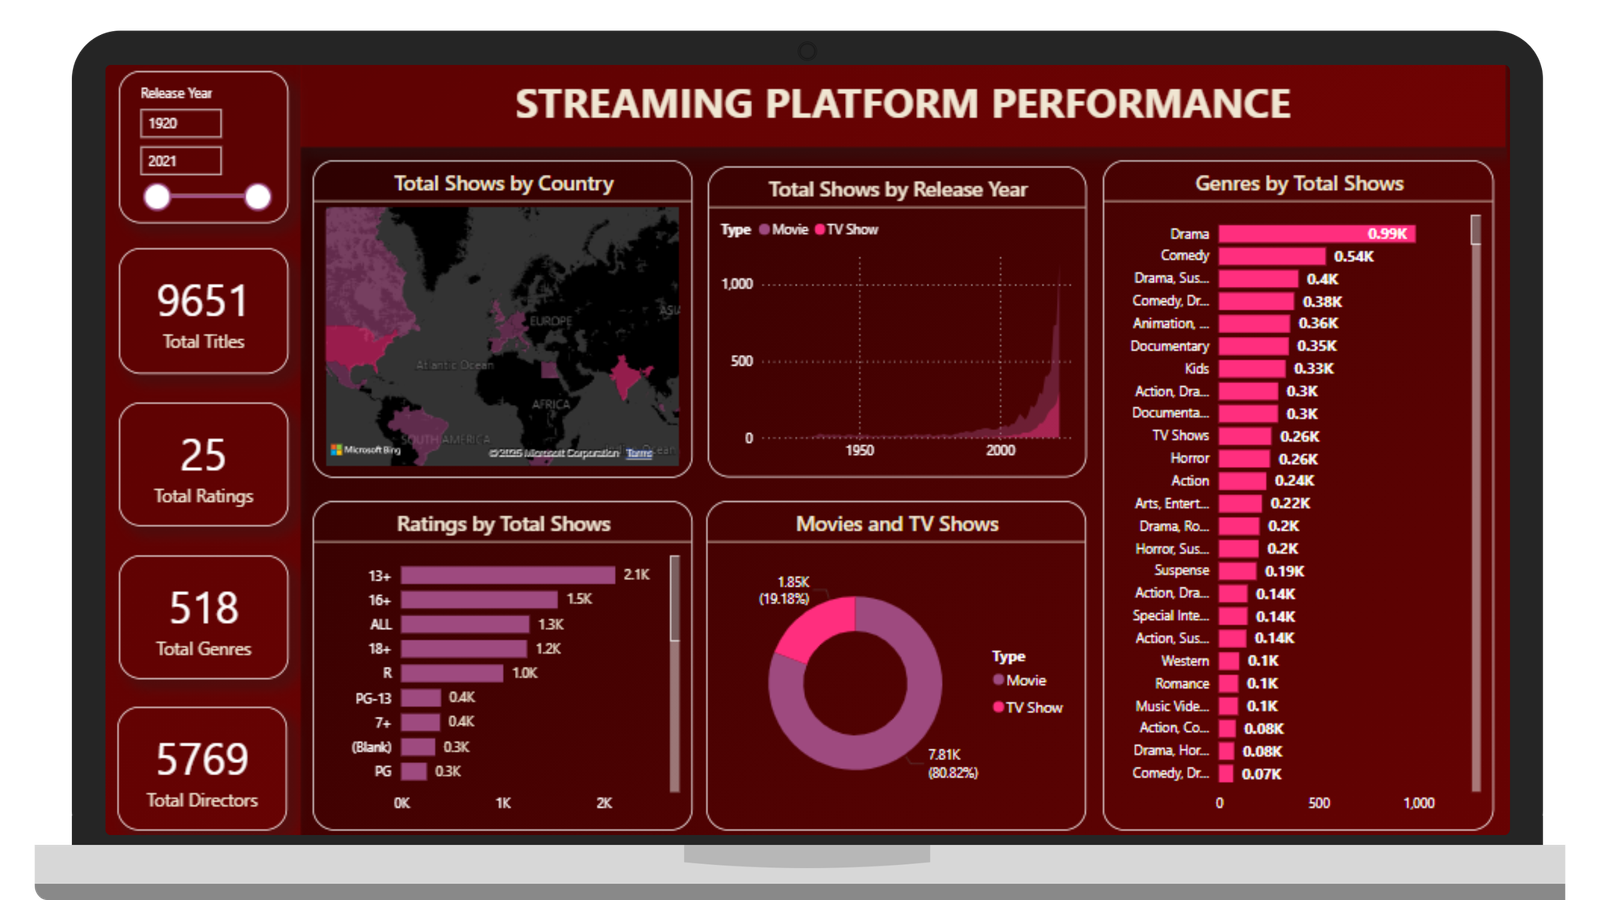
The Streaming Platform Performance Dashboard features dynamic visuals, including maps, bar charts, and donut charts, combined with interactive filters for seamless user experience. It highlights clear data insights to support faster decision-making and better platform performance.
Interactive and User-Friendly Power BI Dashboard.
Insightful Visuals to Highlight Key Business Metrics.
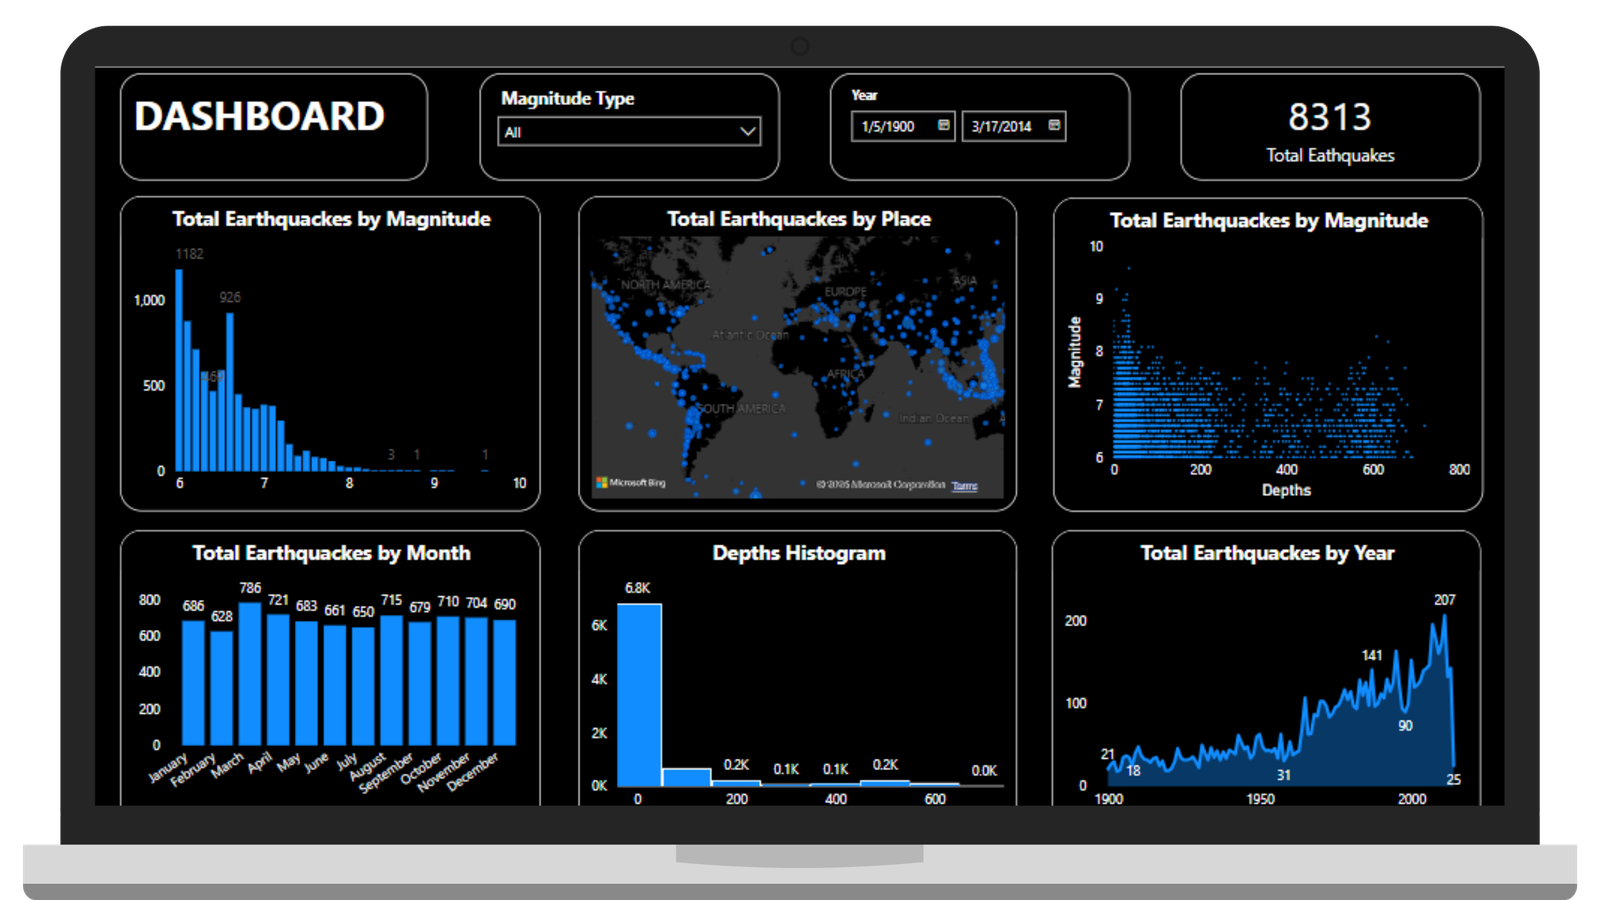
The Earthquake Data Analysis Dashboard provides a global map to visualize earthquake locations, with filters for date range and magnitude type. It features key metrics such as total earthquakes, average depth, and highest magnitude, all updating dynamically to deliver clear, actionable seismic insights.
Interactive and User-Friendly Power BI Dashboard.
Insightful Visuals to Highlight Key Business Metrics.